Car accidents continue to impact thousands of lives across the United States, with 2025 showing concerning trends in collision rates and severity.
Understanding how many car accidents in 2025 have occurred helps drivers recognize the ongoing risks on our roads. We at Schaar & Silva LLP have compiled the latest data to provide Santa Cruz County residents with accurate information about current accident statistics and their consequences.
How Many Accidents Happened in 2025?
The National Safety Council reports that June 2025 saw an estimated 3,420 motor-vehicle deaths nationwide, marking a 14% decrease from June 2024. This positive trend reflects improved safety measures and enforcement efforts across the country. However, the numbers still translate to approximately 12 deaths per day on American roads, which demonstrates that accidents remain a persistent threat to public safety.
California Shows Dramatic Improvement
California leads the nation in traffic fatality reduction, with a remarkable 43% decline in motor-vehicle deaths through June 2025. This translates to 979 fewer fatalities compared to the previous year, according to National Safety Council data. The state’s aggressive approach to traffic safety enforcement and public awareness campaigns has produced measurable results. Despite this progress, California still recorded 5,059 roadway fatalities in 2024 (averaging 12 deaths per day), which highlights the need for continued vigilance and legal protection when accidents occur.
Santa Cruz County Faces Higher Risk Rates
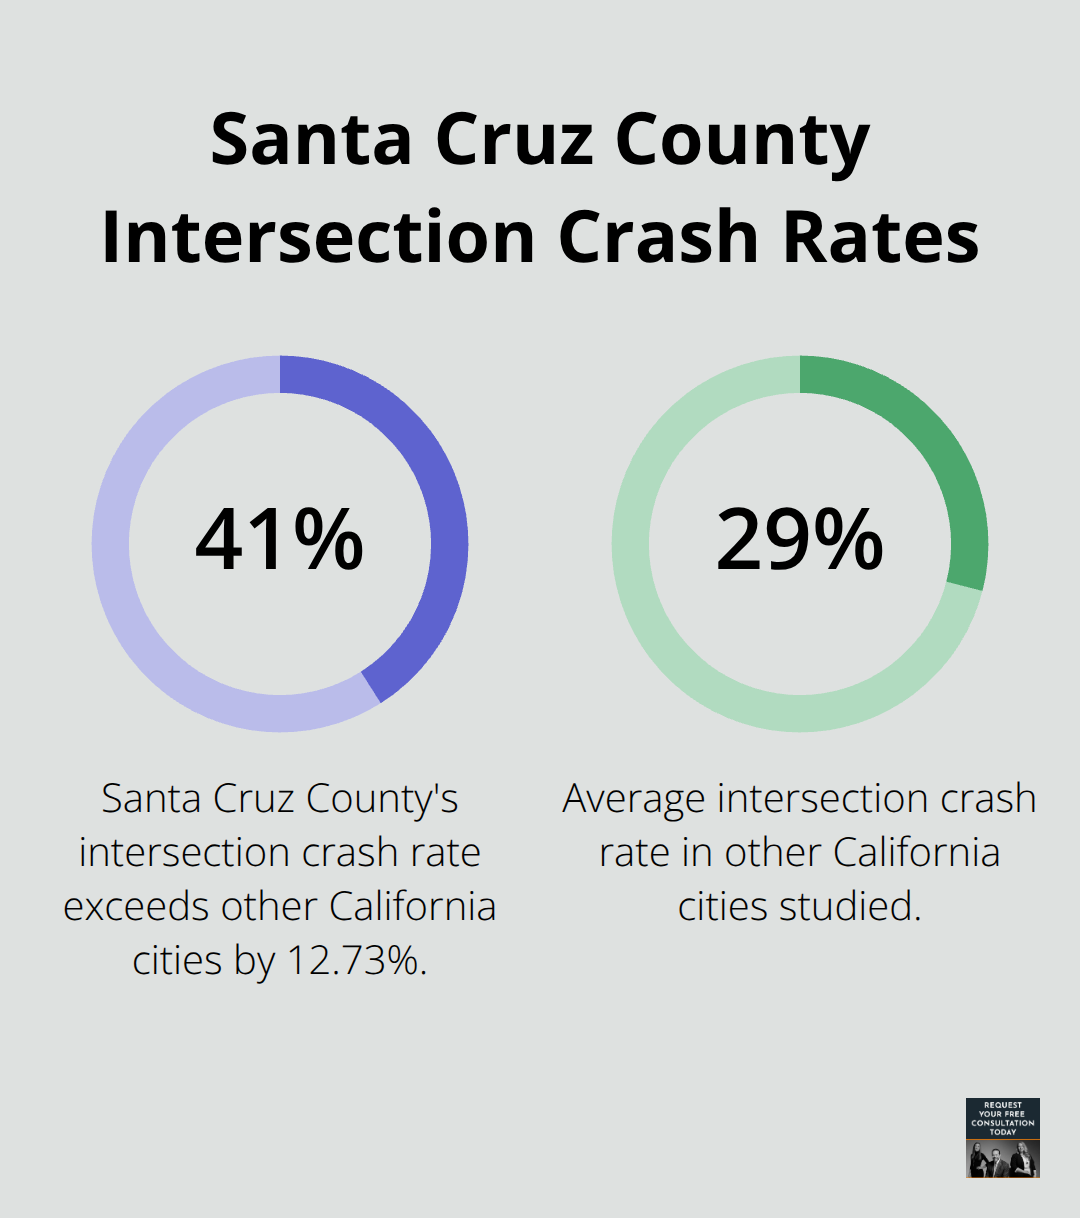
Santa Cruz County presents a troublesome picture for local drivers. The county’s intersection crash rate stands at 41.89%, which exceeds the average of other California cities studied by Jacoby & Meyers by 12.73%. More alarming, the fatality rate from car accidents in Santa Cruz reaches 2.7%, making it 15.38% higher than the state average. The serious injury rate hits 14.7%, which surpasses California’s average by 59.78%.
Most Dangerous Local Intersections
Highway 1 and Highway 9 intersection recorded 11 crashes between 2020 and 2024, making it the most dangerous intersection in the county. Pacific Avenue and Beach Street ranked second with 8 recorded accidents during the same period. Other high-risk intersections include Bay Street and Escalona Avenue, and Beach Street and Cliff Street. These statistics demonstrate that Santa Cruz County residents face elevated risks on local roads.
Understanding these accident patterns helps drivers recognize where crashes occur most frequently, but knowing the underlying causes provides even more valuable protection strategies.
What Causes Most Accidents Today
Distracted drivers create the most dangerous situations on roads in 2025, with phone use while behind the wheel increasing crash rates by 23% according to nationwide education campaigns. The National Highway Traffic Safety Administration confirms that texting, social media checks, and GPS navigation produce the most hazardous behaviors. Santa Cruz County drivers face particular risks on Highway 1 and Highway 9, where complex traffic patterns demand complete attention. Phone-related crashes peak during morning and evening commutes when drivers attempt to handle work communications while operating vehicles.
Alcohol Remains the Deadliest Factor
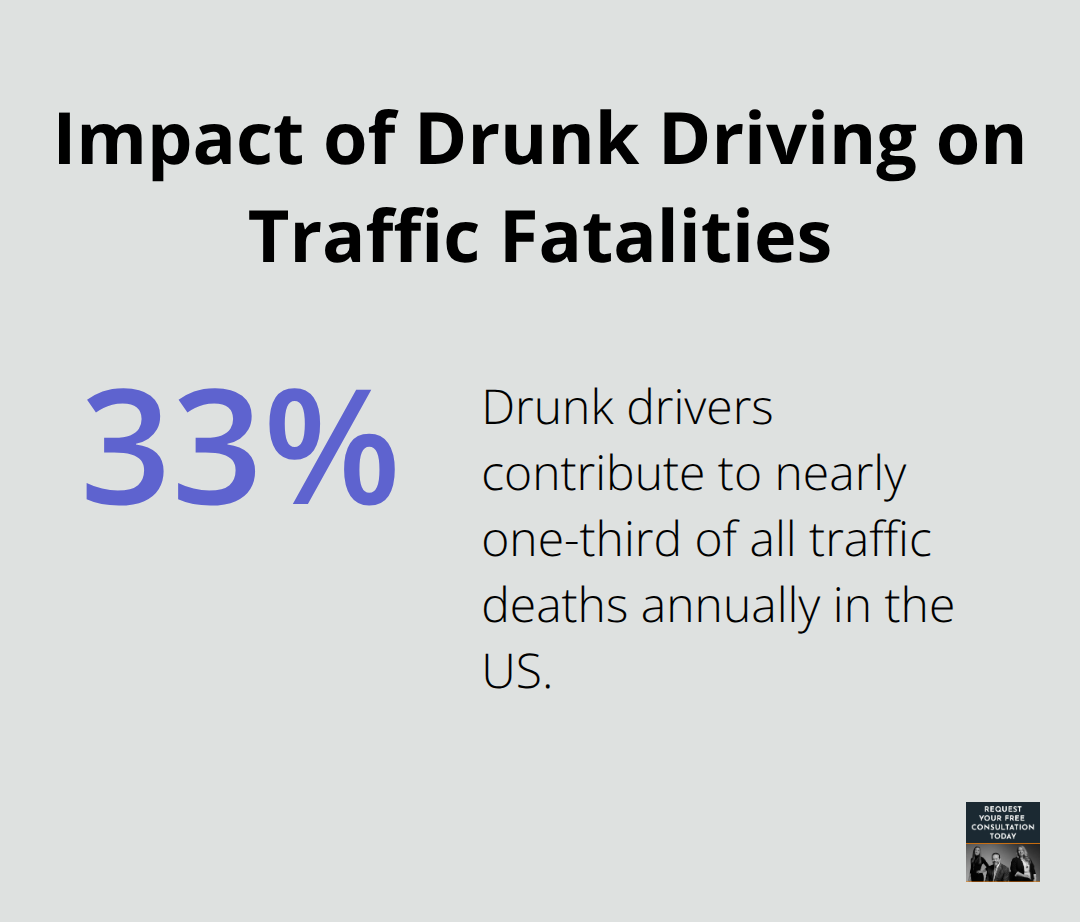
The Centers for Disease Control and Prevention reports that drunk drivers contribute to nearly one-third of all traffic deaths annually across the United States. Los Angeles County recorded 6,291 alcohol-related crashes in 2022, which demonstrates the persistent threat of impaired operation. Santa Cruz County experiences alcohol-related incidents concentrated between 9 PM and 3 AM, particularly on weekend nights. California’s new minimum liability insurance requirements (which doubled to $30,000 per person effective January 2025) reflect the state’s recognition of alcohol-related crash severity.
Weather Creates Unexpected Dangers
Adverse weather conditions contribute substantially to accident rates in 2025, with Santa Cruz County’s coastal fog and sudden rain showers creating treacherous conditions. The National Safety Council data shows that weather-related crashes increase during California’s rainy season, particularly affecting Highway 1’s winding coastal sections. Mechanical failures during poor weather compound these risks, which makes regular vehicle maintenance checks vital for prevention of weather-related accidents.
Speed and Reckless Behavior Escalate Risks
The National Safety Council points out that rushing or excessive speed significantly elevates accident risk on roads. California allocated $51 million in 2024 to improve enforcement against reckless operation as part of safety initiatives. Young drivers often appear overrepresented in crash data (reflecting a nationwide trend), with risky behaviors like aggressive lane changes and tailgating contributing to collision rates. These dangerous practices become even more deadly when combined with other risk factors like distracted or impaired operation.
The financial and personal consequences of these accidents extend far beyond the initial collision, affecting victims and their families in ways that many people never anticipate.
What Do Car Accidents Really Cost Victims
Car accident victims face immediate medical bills that average between $57,000 and $123,000 for serious injuries, according to recent insurance industry data. Emergency room visits alone cost $3,300 on average, while ambulance transport adds another $1,200 to initial expenses. Physical therapy sessions run $150 to $350 per visit, with most patients needing 12 to 20 sessions for soft tissue injuries. Surgery costs escalate dramatically, with spinal procedures reaching $100,000 to $200,000 before rehabilitation expenses. Santa Cruz County residents face additional challenges due to limited local treatment facilities, which forces many to travel to San Jose or San Francisco for advanced care and increases transportation and lodging costs.
Lost Income Creates Long-Term Financial Stress
Workers miss an average of 11 days for minor injuries and up to six months for severe trauma, according to Bureau of Labor Statistics data. California’s average weekly wage of $1,400 means even short-term disabilities cost workers $15,400 in lost income. Self-employed individuals and contractors face worse situations because they lack paid sick leave benefits. The National Safety Council reports that the average economic cost per death in a motor vehicle crash reached $1,750,000 in 2021, which creates extended periods where families lose primary income sources while medical expenses continue to mount. Many families exhaust their savings within three months of a serious accident, which forces them to consider bankruptcy or sell their homes.
Psychological Recovery Takes Years
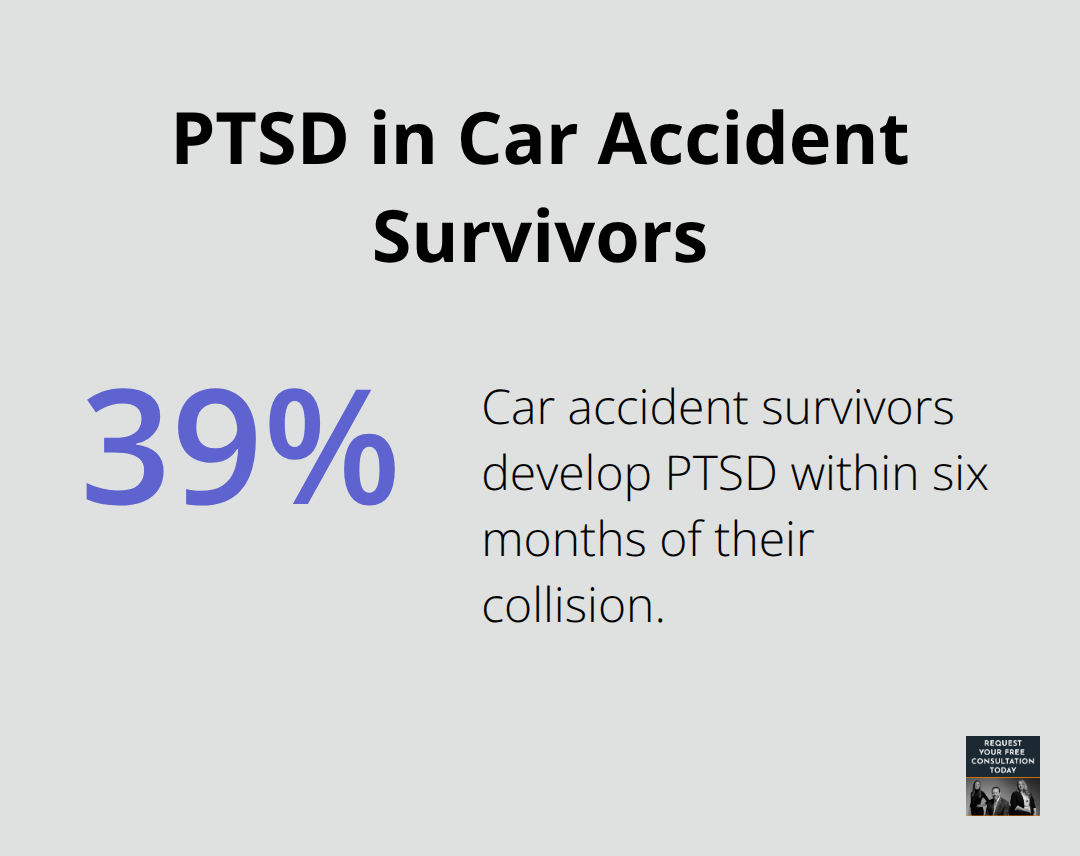
Post-traumatic stress disorder affects 39% of car accident survivors within six months of their collision, according to American Psychological Association research. Treatment costs $200 to $300 per therapy session, with most patients needing weekly sessions for 12 to 18 months. Anxiety and depression medications add $100 to $400 monthly to ongoing expenses. Children involved in accidents often require specialized counseling that costs $250 per session. Sleep disorders and panic attacks frequently develop months after the initial trauma, which creates unexpected medical expenses that insurance companies often dispute or delay paying. Emotional damages demand different evidence strategies than physical injuries.
Hidden Costs Compound Financial Burden
Vehicle replacement costs average $35,000 for total loss claims (based on current market values), while rental car expenses accumulate at $40 to $60 per day during repairs. Home modifications for disabled victims can reach $15,000 to $50,000 for wheelchair accessibility and safety equipment. Family members often take unpaid leave to provide care, which doubles the household income loss. Legal fees and court costs add another layer of expense, though many personal injury attorneys work on contingency arrangements to help victims access representation without upfront payments.
Final Thoughts
The data on how many car accidents in 2025 occurred shows both progress and persistent dangers across California. California achieved a 43% reduction in traffic deaths, yet Santa Cruz County faces elevated risks with intersection crash rates 12.73% above state averages. Serious injury rates remain 59.78% higher than typical California cities.
These statistics create real financial hardship for victims, with medical costs that range from $57,000 to $123,000 for serious injuries. Lost wages average $15,400 even for minor disabilities (affecting workers for weeks or months). The psychological impact affects 39% of survivors, who require months of therapy at $200 to $300 per session.
When accidents happen, experienced legal representation becomes vital for navigation of insurance disputes and securing fair compensation. We at Schaar & Silva LLP help Santa Cruz County residents through the complex aftermath of collisions. The combination of higher local accident rates and substantial financial consequences makes legal guidance particularly important for our community.