
Car accidents affect drivers of all ages, but the question remains: who causes more car accidents, old or young drivers? The answer isn’t as straightforward as many people assume.
Statistics reveal surprising patterns when comparing crash rates across different age groups. We at Schaar & Silva LLP see these trends reflected in the cases that come through our Santa Cruz County office every day.
What Do the Numbers Really Show
Teen Drivers Lead Fatal Crash Statistics
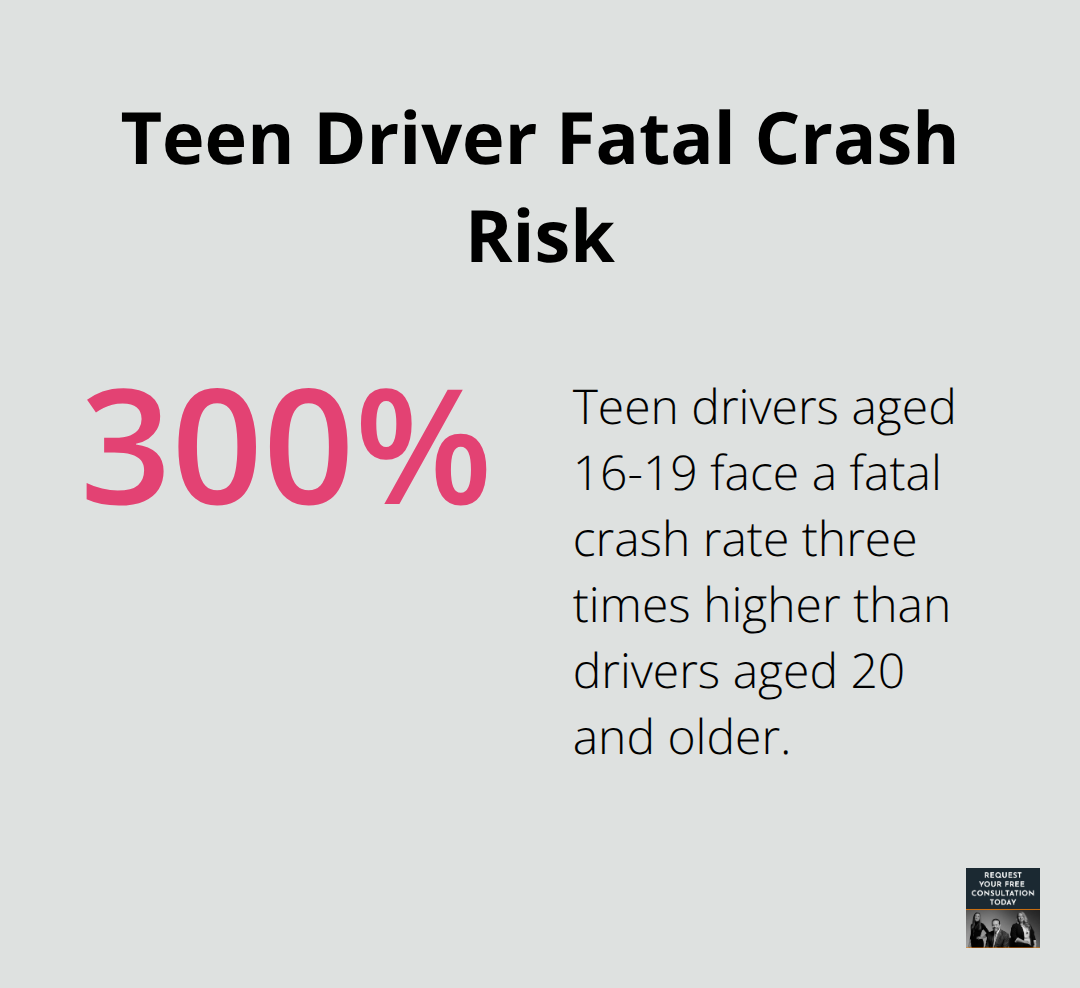
Teen drivers aged 16 to 19 face a fatal crash rate three times higher than drivers aged 20 and older, according to the CDC. The National Safety Council reported 5,588 fatalities in 2023 involving at least one teen driver, which represents an increase from 5,361 fatalities in 2022.
California alone saw 188 teen drivers aged 15-20 die in crashes in 2021, placing the state second only to Texas in teen driver fatalities. Los Angeles accounts for approximately 50% of fatal accidents involving teen drivers in California. The deadliest period occurs between 3 p.m. and 11 p.m., when around 50% of these accidents happen.
Middle-Aged Drivers Set the Safety Standard
Drivers between ages 30 and 50 consistently show the lowest accident rates per mile driven. Their combination of experience and physical capability creates the safest demographic on California roads. The Insurance Institute for Highway Safety data confirms this group maintains steady reaction times while they possess sufficient experience to recognize hazards quickly.
Senior Drivers Face Physical Limitations
Elderly drivers in California cause an average of 22,604 car accidents annually from 2019 to 2023 (ranking as the 8th leading cause of accidents statewide according to the California Highway Patrol). While older drivers often self-regulate by avoiding night driving and bad weather, their involvement in fatal crashes increases significantly due to physical frailty.
The Insurance Institute for Highway Safety reports that drivers aged 65 and older experience higher percentages of fatal crashes despite lower overall crash rates. This occurs primarily because their bodies cannot withstand impact forces as well as younger drivers. Loss of vision and hearing among elderly drivers also contributes significantly to accidents, as poor sensory awareness leads to missed signs and warnings.
These statistics paint a clear picture, but the raw numbers only tell part of the story. The reasons behind these accident patterns reveal even more about what makes certain age groups riskier on the road.
Why Do Different Age Groups Crash Differently
Young Drivers Take Dangerous Risks
Young drivers create dangerous situations through specific behaviors that experienced drivers avoid. Teen drivers exceed speed limits at rates 1.5 times higher than older drivers according to the National Highway Traffic Safety Administration. Alcohol affects 22% of drivers aged 16-17 who die in crashes, with blood alcohol concentrations of .08% or higher based on Insurance Institute for Highway Safety data from 2022.
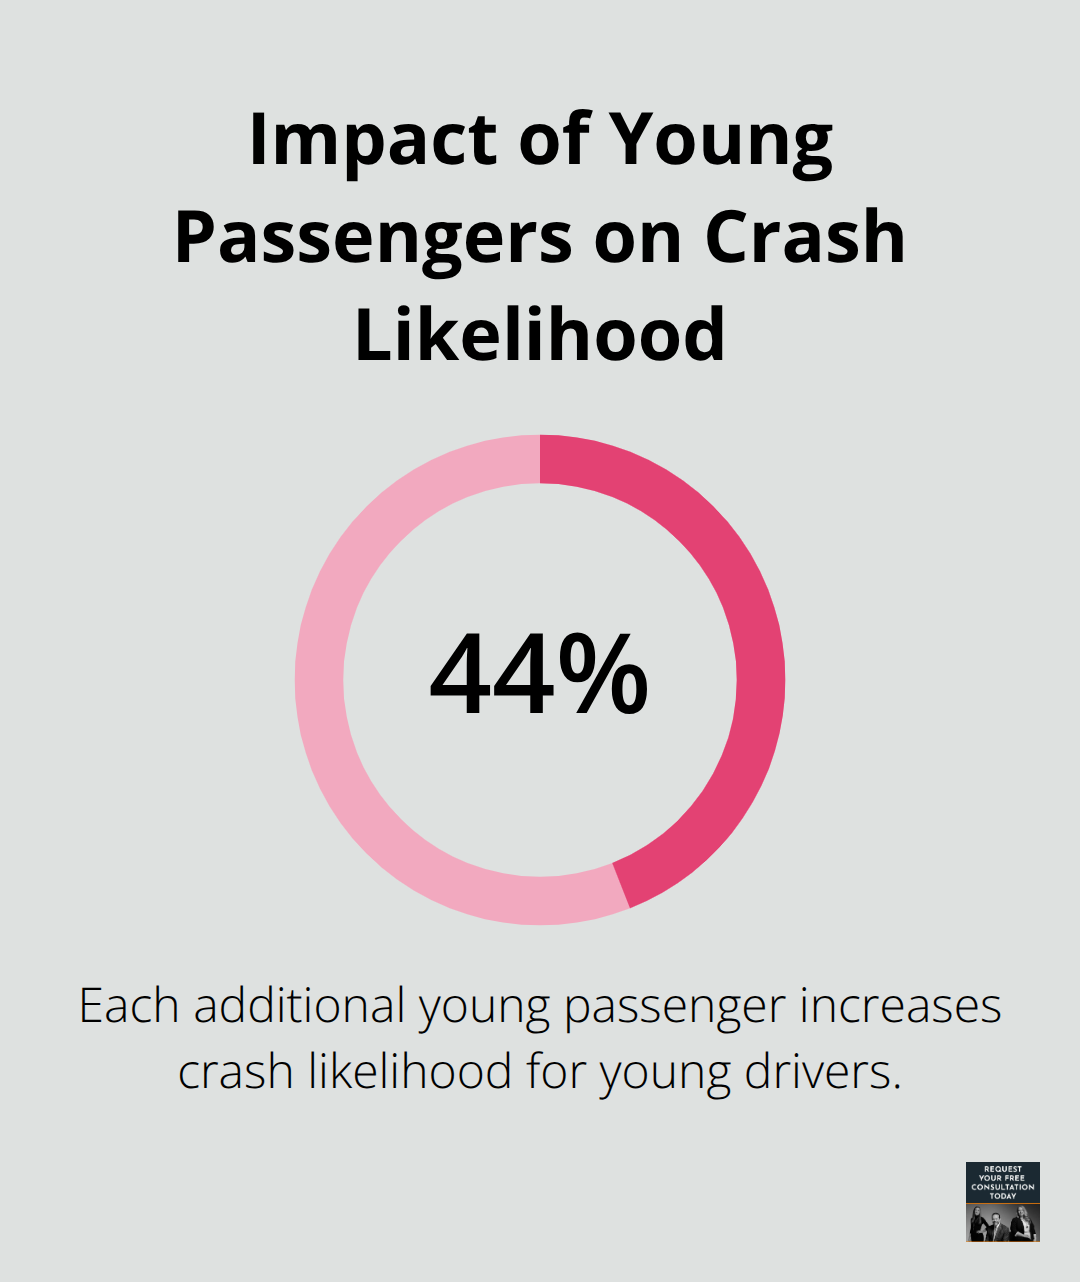
The presence of passengers amplifies risk-taking behaviors dramatically. Each additional young passenger increases crash likelihood by 44% according to research from the AAA Foundation for Traffic Safety. Young drivers also ignore seat belt use more frequently than other age groups, which increases their risk during accidents.
Physical Decline Creates New Hazards
Older drivers face measurable physical changes that directly impact their ability to drive safely. Vision deterioration affects 90% of drivers over 65, which reduces their ability to judge distances and spot hazards according to the American Optometric Association. Reaction times slow by 0.5 seconds on average after age 70 (this translates to an additional 37 feet of stopping distance at highway speeds).
Cognitive decline affects decision-making speed significantly. Older drivers take 40% longer to process complex traffic situations compared to middle-aged drivers. Hearing loss compounds these problems and prevents detection of emergency vehicles and other audio warnings.
Experience Cannot Overcome Biology
The trade-off between experience and physical capability creates different risk profiles across age groups. Drivers aged 30-50 benefit from peak reaction times combined with sufficient road experience, which results in the lowest accident rates per mile driven. Young drivers possess sharp reflexes but lack hazard recognition skills that develop over years of practice.
Senior drivers understand traffic patterns but cannot physically respond as quickly when situations demand immediate action. This biological reality explains why fatal crash rates increase dramatically after age 75, despite decades of experience and generally cautious behavior patterns.
These age-related factors create distinct legal challenges when accidents occur, particularly regarding liability determination and insurance coverage.
How Does Age Affect Your Legal Case
Insurance Premium Variations by Age
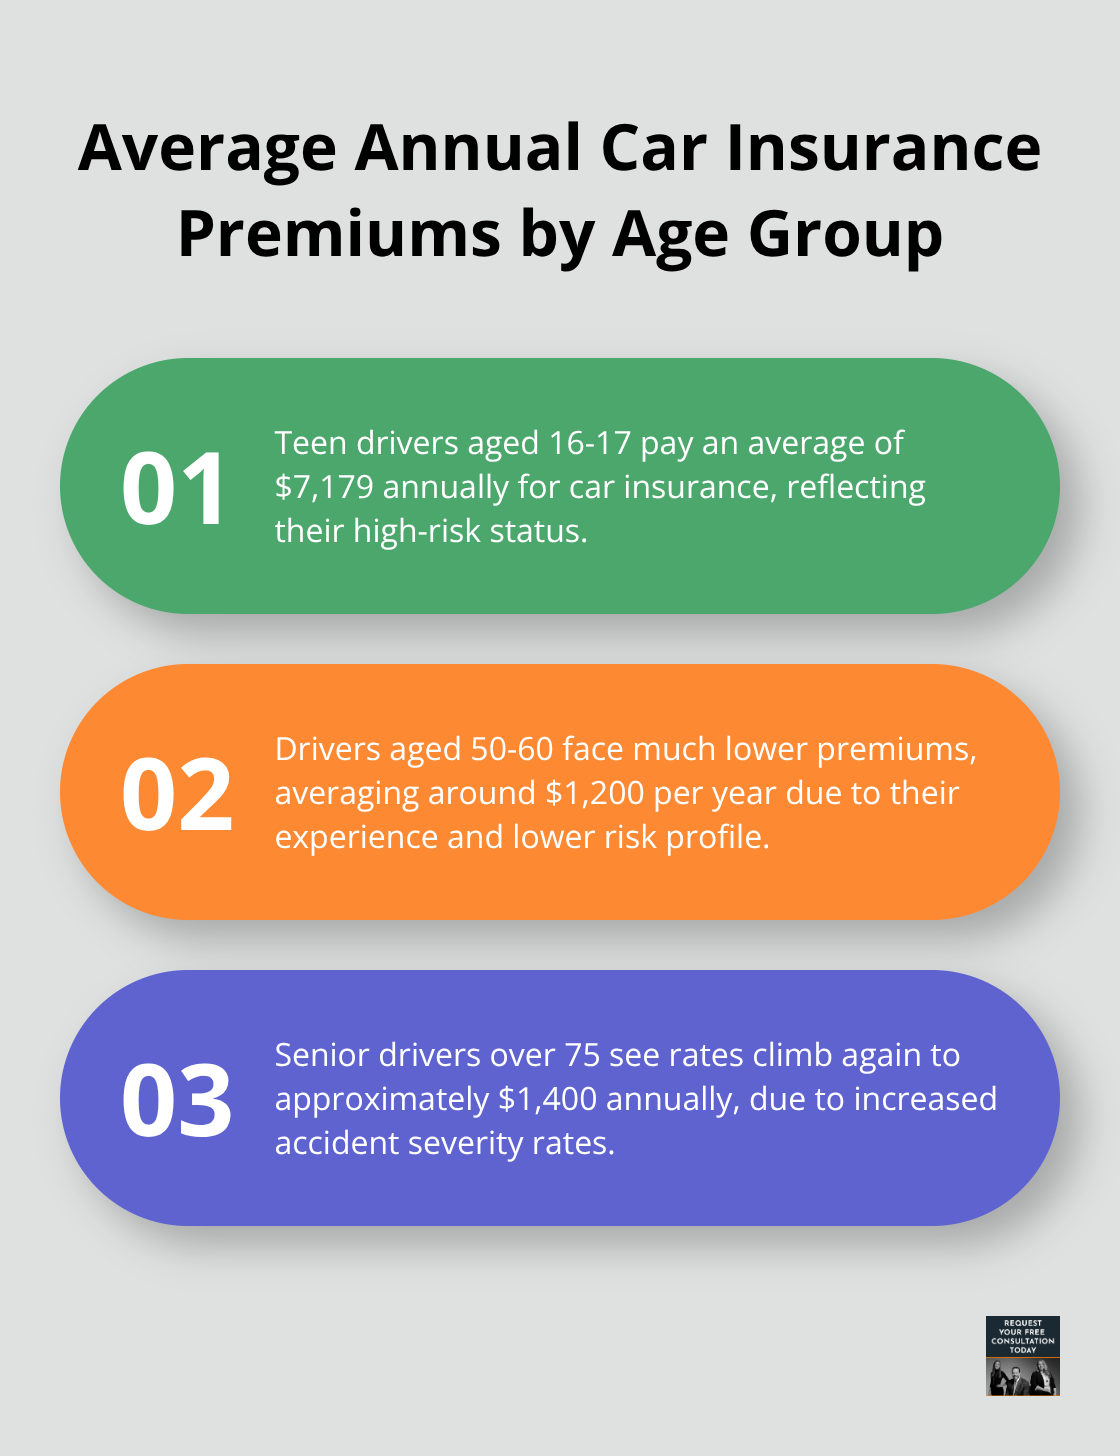
Insurance companies calculate premiums based on statistical risk, and age disparities create dramatic cost differences across demographics. Teen drivers aged 16-17 pay an average of $7,179 annually for car insurance according to the Insurance Information Institute, while drivers aged 50-60 face premiums around $1,200 per year. Senior drivers over 75 see rates climb again to approximately $1,400 annually due to increased accident severity rates. These premium differences directly reflect each age group’s claims history and accident patterns.
Age-Based Liability Considerations
Age significantly influences liability determination in accident cases, particularly when physical limitations or inexperience contribute to crashes. Courts examine whether older drivers should have recognized their decline in abilities and adjusted their habits accordingly. California requires vision tests for drivers over 70 during license renewal, and failure to meet these standards can establish negligence in accident cases.
Young drivers face different liability challenges, as their inexperience doesn’t excuse reckless behaviors like speed violations or distracted operation. The state’s graduated license system creates additional legal considerations when teen drivers violate passenger restrictions or curfew requirements.
License Renewal Requirements
License renewal requirements become stricter with age. Drivers over 70 must renew in person every five years and pass vision tests, while younger drivers can renew online for longer periods. These age-specific regulations create additional legal factors that courts consider when they determine fault in accident cases.
Legal Complexity in Age-Related Cases
Age-related factors complicate accident cases and require thorough investigation of each driver’s compliance with age-specific regulations. Physical limitations in older drivers and behavioral patterns in younger drivers both influence crash causation analysis. Legal teams must examine whether drivers met their age-appropriate responsibilities and followed applicable restrictions at the time of the accident.
Final Thoughts
The data clearly shows that young drivers pose the greater risk on California roads. Teen drivers aged 16-19 have fatal crash rates three times higher than older drivers, with 5,588 fatalities in 2023 alone. While elderly drivers cause 22,604 accidents annually in California, their crashes result from physical limitations rather than reckless behavior patterns.
When we examine who causes more car accidents old or young, the statistics favor older drivers despite their physical challenges. Young drivers create dangerous situations through speed violations, alcohol use, and distracted operation that experienced drivers avoid. The answer becomes clear when we compare the severity and frequency of accidents across age groups (with teen drivers consistently ranking highest in fatal crash statistics).
If you face an accident in Santa Cruz County, Schaar & Silva LLP provides comprehensive legal support for medical bills and property damage claims. We handle the legal complexities while you focus on recovery. Our team serves Santa Cruz residents who need dedicated legal assistance after serious accidents.